As an appliance repair company serving Orange County, we track what breaks, when it breaks, and how often. But we also rely on published industry data from Consumer Reports, the National Association of Home Builders (NAHB), and Yale Appliance's annual reliability reports to put individual repair calls into context. This article synthesizes that research into a single reference you can use when an appliance fails and you need to decide: repair or start planning for replacement?
The Bathtub Curve: How Appliance Failure Actually Works
Reliability engineers use a model called the bathtub curve to describe how products fail over time. It gets its name from the shape of the failure rate graph: elevated at the left end, low and flat in the middle, then rising again at the right. The same pattern holds for virtually every major household appliance.
The Three Phases of Appliance Reliability
The practical implication: an appliance that fails in year 1 or year 2 is almost certainly a warranty or early-defect issue, not a sign the unit will be troublesome long-term. An appliance that fails in years 3 through 7 is experiencing a single-component failure in its most reliable period. An appliance that starts having problems at year 10 or beyond is entering wear-out, and the next failure is not a matter of if but when.
Manufacturer warranties are calibrated to this curve. A standard 1-year parts-and-labor warranty covers infant mortality. Extended warranties of 5 or 10 years on specific components (compressors, motors) signal the maker's confidence in those parts through the useful life period. Sub-Zero's 12-year sealed-system warranty, for example, is a direct statement that the company expects those components to survive well into the wear-out phase.
Year-by-Year Failure Rate Table (All Major Appliances)
The table below shows estimated annual failure probability for major household appliances across four age ranges. Data is synthesized from Consumer Reports appliance reliability surveys (2022 and 2024 cohorts) and cross-referenced with expected service life endpoints from the NAHB Study of Life Expectancy of Home Components (2021 edition). "Annual failure probability" means the estimated chance that a given unit will require a repair in a specific year.
| Appliance | Age 1-3 | Age 4-7 | Age 8-11 | Age 12-15 | Avg. Lifespan |
|---|---|---|---|---|---|
| Refrigerator (top-freezer) | 3-4% | 3-5% | 7-10% | 13-18% | 13-17 yrs |
| Refrigerator (French door) | 5-7% | 6-9% | 12-16% | 20-26% | 10-14 yrs |
| Refrigerator (side-by-side) | 4-6% | 5-8% | 10-14% | 16-22% | 12-15 yrs |
| Washing machine (top-load) | 3-5% | 4-6% | 9-12% | 15-20% | 10-14 yrs |
| Washing machine (front-load) | 6-8% | 7-10% | 13-18% | 21-28% | 9-12 yrs |
| Dryer (gas) | 2-4% | 3-5% | 6-9% | 11-15% | 13-16 yrs |
| Dryer (electric) | 2-3% | 3-4% | 6-8% | 10-14% | 13-15 yrs |
| Dishwasher | 5-7% | 6-9% | 12-17% | 19-26% | 9-12 yrs |
| Gas range / oven | 2-3% | 3-5% | 5-8% | 9-14% | 13-17 yrs |
| Electric range / oven | 3-4% | 4-6% | 7-10% | 12-17% | 13-15 yrs |
| Over-the-range microwave | 5-7% | 8-11% | 15-20% | 22-30% | 7-10 yrs |
| Garbage disposal | 3-4% | 4-6% | 8-11% | 14-19% | 10-12 yrs |
Rates represent estimated annual repair probability per unit, not cumulative lifetime rates. Ranges reflect variation across brands and usage conditions. Source: Consumer Reports appliance reliability surveys (2022 and 2024 cohorts); NAHB Study of Life Expectancy of Home Components (2021 edition).
Per-Appliance Breakdown
Refrigerators
Refrigerators show the widest reliability spread of any major appliance category because configuration matters enormously. Top-freezer models are the most reliable: Consumer Reports' 2024 data shows repair rates of just 3-5% annually through year 7. French door models, which combine a bottom freezer, multiple doors, and complex ice-and-water systems, run roughly twice the repair rate of top-freezer units in the same age bracket.
The most common failure points in the wear-out phase are the ice maker assembly, defrost system components (heater, timer, thermostat), and evaporator fan motors. Sealed-system failures (compressor, condenser coils) are rarer but expensive: typically $650-$1,200 to repair on a standard unit. On a Sub-Zero or other premium built-in refrigerator, sealed-system repair is almost always worth it because replacement costs $8,000 or more.
The practical decision point for a standard refrigerator: if it's a top-freezer unit under 12 years old, repair almost always makes sense unless the failure is a sealed-system issue on an older unit. French door units warrant closer scrutiny after year 9, especially if the ice maker or sealed system is involved.
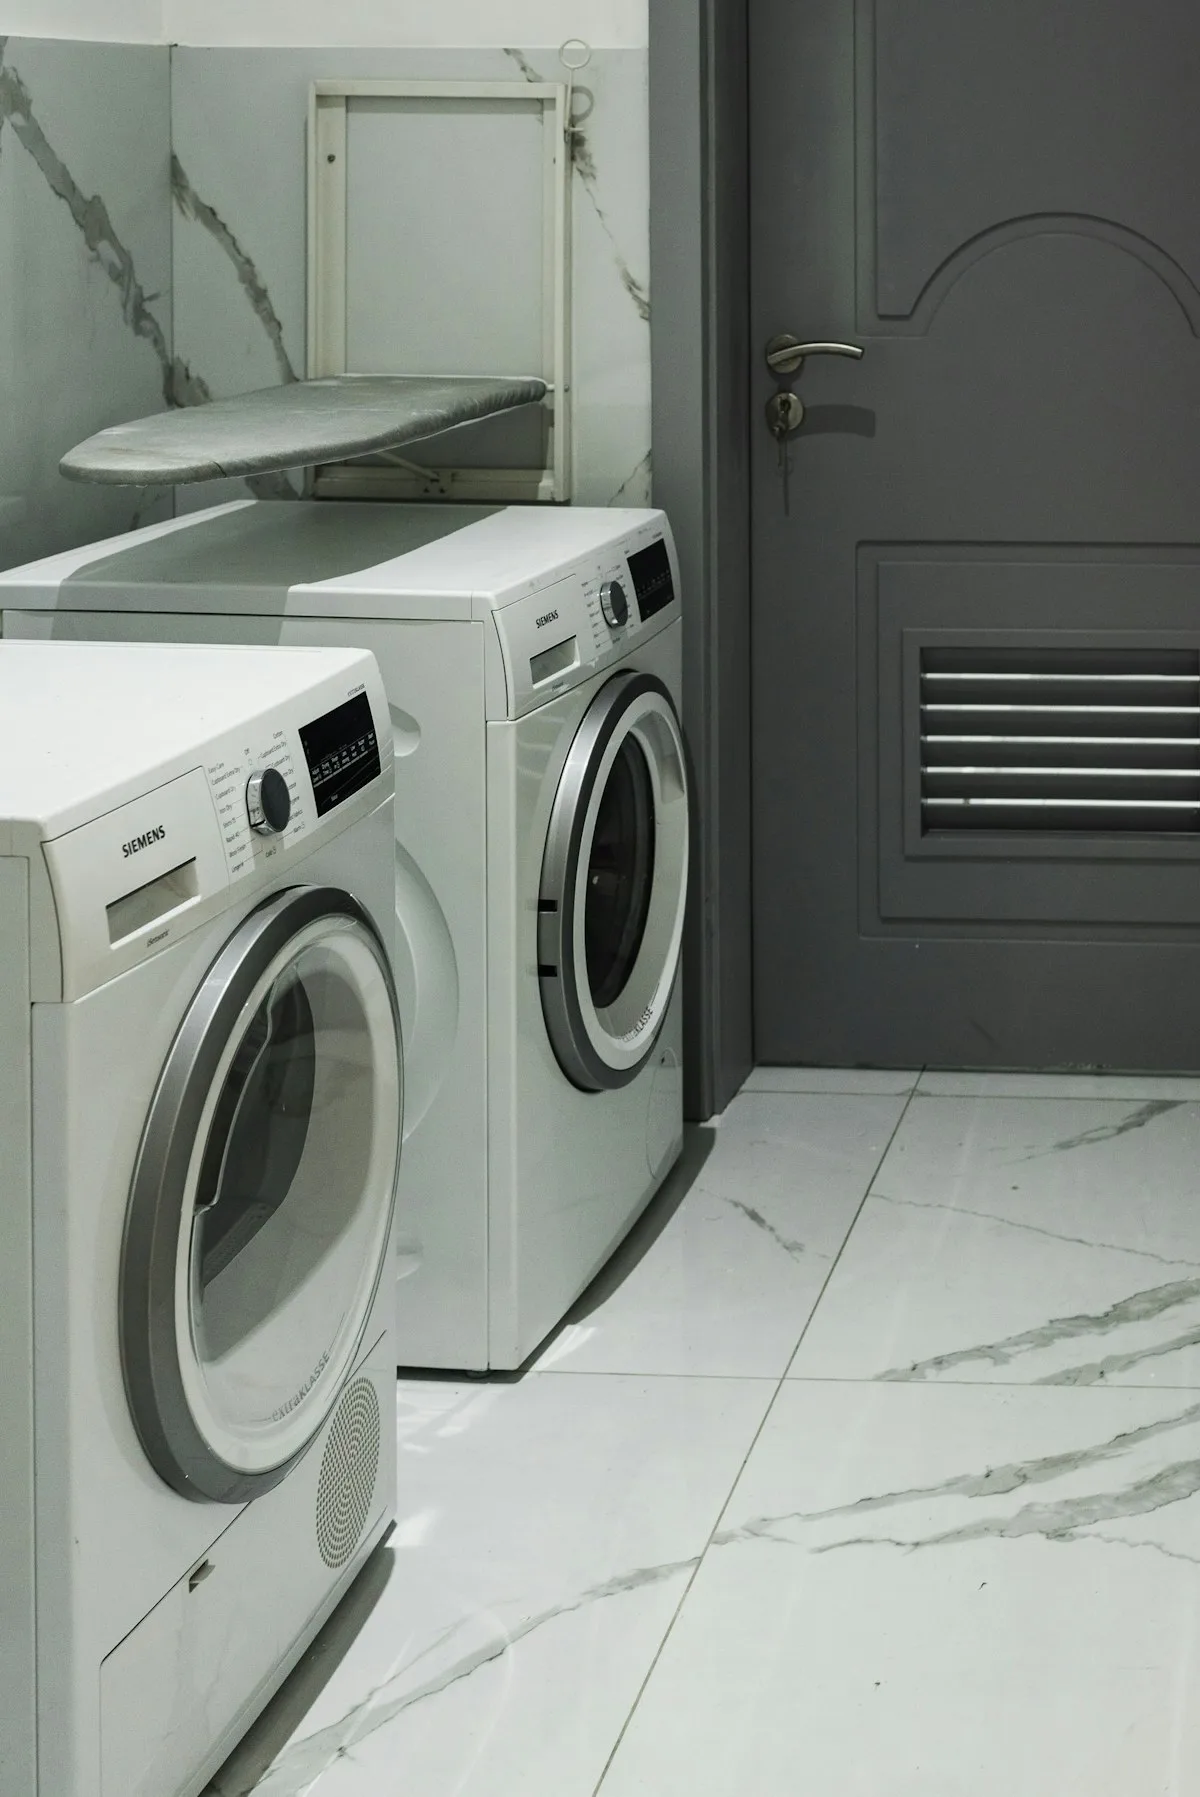
Washing Machines
Washing machines show a pronounced split between top-load and front-load reliability. Consumer Reports' multi-year surveys consistently show front-load machines entering the moderate failure zone several years earlier than top-load equivalents. The primary culprits in front-loaders are door boot seals, drum bearings, and control boards. Top-loaders tend to hold up better mechanically but develop issues with lid switches, drive belts, and drain pumps in the later years.
A front-load washer exhibiting drum bearing noise at year 7 is at a decision point. Bearing replacement is a $350-$550 repair. On a 7-year-old front-loader approaching the end of its statistical useful life, that cost should be weighed carefully against a replacement unit. A top-load washer with a failed pump at year 7 is a much easier call: the pump repair is $150-$250, and the unit likely has 3-5 years remaining.
Dryers
Dryers are one of the most mechanically simple major appliances, which is reflected in their repair rates. According to Consumer Reports' 2024 reliability survey, gas and electric dryers show annual repair rates of just 2-4% in years 1-3, rising only moderately through year 9. Gas dryers and electric dryers perform nearly identically in the mid-life period; differences emerge mainly in what fails (igniters and gas valve coils vs. heating elements).
The most common dryer repairs across all age ranges are heating element replacement (electric), igniter replacement (gas), thermal fuse replacement, and drum belt replacement. All of these are relatively inexpensive ($120-$280 typical in Orange County) and straightforward. A dryer under 10 years old with any of these failures is almost always worth repairing. A dryer over 12 years old with a motor failure is a closer call: motor replacement runs $280-$450, and the unit is in wear-out territory.
Dishwashers
Dishwashers have a shorter average lifespan than most homeowners expect: the NAHB Study of Life Expectancy places the average at 9 years, with well-maintained units potentially reaching 12. Consumer Reports' 2024 reliability data shows dishwashers entering moderate repair territory (6-9% annually) by years 4-7, earlier than refrigerators or dryers.
Common failure modes include drain pump failure, inlet valve failure, control board issues, and spray arm deterioration. A dishwasher under 7 years old with a pump failure ($150-$280 repair) is almost certainly worth fixing. A dishwasher at 9 or 10 years with a control board failure ($250-$400) is at or past its statistical lifespan: replacement is often the smarter choice unless it's a premium Miele unit, which can realistically run 15-20 years with proper maintenance.
Gas and Electric Ranges / Ovens
Ranges and ovens are among the most durable appliances in terms of both expected lifespan and mid-life failure rates. Gas ranges in particular show some of the lowest annual repair probabilities of any category (2-5% through year 9), reflecting their mechanical simplicity. Common failures in the early years are igniter issues; in the later years, control board failures and bake element replacements are most frequent.
A gas range under 12 years old is almost always worth repairing regardless of the failure type. A Wolf range or Thermador range carries that logic even further: these units can hold up for 20 years or more, and replacement costs $5,000 and up. The repair-vs-replace math strongly favors repair for premium ranges across nearly every failure scenario.
Over-the-Range Microwaves
Microwaves show the steepest reliability decline curve among major appliances, with annual repair probability rising from 5-7% in years 1-3 to 15-20% by years 8-11. This reflects both the short expected lifespan (NAHB places it at 9 years) and the complexity of the magnetron, control board, and ventilation system combined in a single unit.
A countertop microwave over 6 years old is almost never worth repairing: replacement cost is too low. An over-the-range or built-in microwave is a different calculation because installation complexity adds value. A built-in unit under 6 years old with a failed magnetron or door switch ($150-$280 repair) is worth fixing. An over-the-range unit past year 8 with a control board failure ($200-$350) is typically at replacement territory.
Garbage Disposals
Garbage disposals are among the simplest motor-driven appliances in a home, and their repair rates reflect that simplicity. InterNACHI's Standard Estimated Life Expectancy Chart places the average disposal lifespan at 10-12 years. Most early-life failures are motor jams or reset-button trips rather than true mechanical failure. A humming disposal that won't spin is often a jammed flywheel, a 5-minute fix that does not require a technician.
Genuine motor failure or cracked grinding chamber in a disposal under 8 years old usually argues for replacement rather than repair: a new mid-grade disposal costs $80-$200 installed, and repair parts often cost nearly as much. Past year 10, replacement is almost always the right call.
Brand-Tier Failure Rate Comparison
The data above reflects averages across brands. Yale Appliance's 2024 Annual Reliability Report, which aggregates service data across tens of thousands of units sold, shows meaningful reliability differences by brand tier.
| Tier | Representative brands | Typical 5-yr repair rate | Typical 10-yr repair rate |
|---|---|---|---|
| Budget | Amana, Hotpoint, entry-level GE | 18-28% | 40-55% |
| Mid-range | Whirlpool, LG, Samsung, Bosch (standard) Samsung runs higher-than-average rates within this tier per Yale 2024 |
12-20% | 28-42% |
| Premium | Sub-Zero, Wolf, Miele, Thermador, Viking | 8-14% | 18-30% |
Source: Yale Appliance Annual Reliability Report 2024. Repair rates represent percentage of units requiring at least one service call within the stated period. Rates vary by specific model line and usage conditions.
The honest framing: premium appliances fail less often, but parts cost more when they do fail. A Viking range with a failed bake igniter at year 12 may cost $350-$500 to repair; the equivalent repair on a budget range is $120-$200. The premium unit is still worth repairing because replacement is $4,000-$8,000. But the calculus is different for a premium dishwasher versus a budget dishwasher when both are at year 10 and facing a control board failure.
See our Sub-Zero repair vs. replace guide for a deeper look at premium refrigerator decision-making, and our Orange County repair cost guide for current pricing by appliance type.
Reading the Curve: When to Budget for Replacement
The failure rate table and per-appliance sections above give you the data. Here is how to translate it into an action:
For a full framework including the 50% rule and current Orange County repair costs, see our appliance repair vs. replace decision guide. If you have a premium appliance, the math skews heavily toward repair in almost every scenario; our cost guide walks through the numbers by brand tier.
Frequently Asked Questions
Need a diagnosis before you decide?
Our technicians will tell you exactly where your appliance sits in its failure curve and give you an honest repair estimate. $99 diagnostic fee applied toward the repair if you proceed. Serving all of Orange County.
Book a DiagnosisReferences
- Consumer Reports Appliance Reliability Surveys (2022 and 2024). Annual member-reported data on repair rates by appliance type and brand. Used for failure rate ranges by appliance category. Available to Consumer Reports members at consumerreports.org/appliances.
- National Association of Home Builders (NAHB) / International Code Council. "Study of Life Expectancy of Home Components," 2007 original; 2021 revised edition. Primary source for expected service life by appliance type. Available at nahb.org.
- InterNACHI Standard Estimated Life Expectancy Chart for Homes. International Association of Certified Home Inspectors. Industry reference for expected component lifespan including garbage disposals and microwaves. Available at nachi.org/life-expectancy.
- Yale Appliance Annual Reliability Report 2024. Service data from Yale Appliance (Boston, MA), aggregating repair rates across brands sold. Used for brand-tier failure rate comparisons. Available at Yale Appliance Blog.
- J.D. Power Appliance Satisfaction Study (most recent available). Consumer-reported reliability and satisfaction rankings by brand. Referenced for brand-tier context. Available at jdpower.com/business/appliances.
- Sub-Zero Group. Sub-Zero warranty terms (12-year sealed system, 5-year parts). Referenced as manufacturer proxy for expected component reliability. subzero-wolf.com/assistance/warranty.